


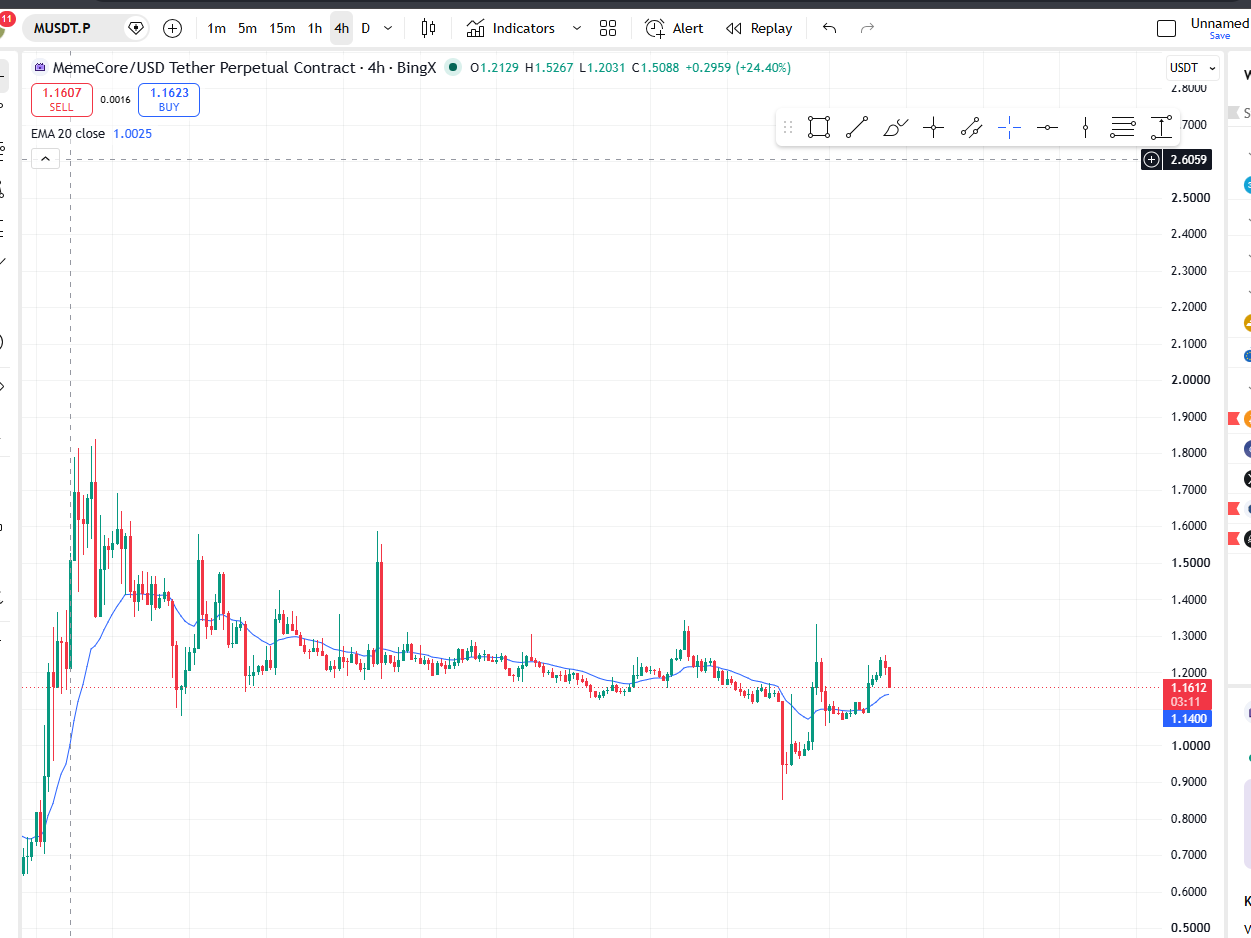
MemeCore is showing the first meaningful signs of recovery after spending weeks in a prolonged consolidation phase. On the 4-hour chart, buyers have successfully defended the recent low near the psychological $1.00 level, producing a sharp rebound that has pushed price back above the 20-period Exponential Moving Average (EMA).
Although the broader trend remains neutral after months of sideways trading, short-term momentum has clearly shifted in favor of the bulls. The coming sessions will determine whether this move develops into a sustained trend reversal or simply becomes another lower high within the existing range.
Market Structure
After its explosive launch, MemeCore experienced heavy profit-taking that gradually transitioned into a long period of declining volatility. Instead of continuing a strong downtrend, price settled into an extended sideways range between roughly $1.05 and $1.30.
This type of price action often represents an accumulation phase where buyers and sellers reach temporary equilibrium before the next major directional move.
The recent sharp rejection below $1.00 stands out as one of the most important events on the chart. Bears briefly pushed the market lower, but buyers quickly absorbed the selling pressure and drove price back into the trading range. Such false breakdowns frequently signal seller exhaustion and can precede stronger upside moves.
EMA Signals Improving
One encouraging technical development is the relationship between price and the 20 EMA.
For much of the previous consolidation, MemeCore traded below or around the moving average, reflecting weak momentum. During the recent recovery, however, price reclaimed the EMA and continues to trade above it.
While a single EMA crossover should never be viewed as confirmation of a new bull trend, it does indicate that short-term momentum has shifted in buyers’ favor.
If the EMA begins sloping upward while price remains above it, confidence in the bullish scenario would increase significantly.
Resistance Levels to Watch
The first major challenge lies around $1.20–$1.25, where price has repeatedly stalled over recent weeks.
A decisive 4-hour close above this zone would indicate that buyers are beginning to regain control.
Beyond that, traders should monitor:
- $1.30 – Previous swing highs and an important resistance level.
- $1.45–$1.50 – Earlier rejection area where sellers previously entered aggressively.
- $1.70+ – Longer-term resistance from the post-launch decline.
Breaking these levels with increasing volume would strengthen the argument that MemeCore is transitioning from consolidation into a new bullish trend.
Support Remains Critical
Despite the improving outlook, support remains the most important area to monitor.
Key support levels include:
- $1.14–$1.15 – Near the current 20 EMA.
- $1.05 – Lower boundary of the recent trading range.
- $0.95–$1.00 – Psychological support and the location of the recent false breakdown.
As long as price remains above these areas, buyers maintain the short-term advantage.
Volume Still Needs Improvement
One element still missing from this recovery is sustained buying volume.
While the rebound from the lows was impressive, the market has yet to produce consecutive high-volume bullish candles that typically accompany stronger trend reversals.
Professional traders will likely wait for increased participation before declaring the downtrend fully reversed.
Without stronger volume, resistance levels may continue to reject rallies.
Bullish Scenario
The optimistic outlook would involve:
- Holding above the 20 EMA.
- Higher lows continuing to form.
- A breakout above $1.25–$1.30.
- Rising trading volume confirming institutional participation.
If these conditions develop, MemeCore could begin targeting higher resistance levels over the coming weeks.
Bearish Scenario
The bullish momentum would weaken if price falls back below the EMA and loses the $1.05 support region.
A break beneath the recent recovery low could expose the market to another test of the $1.00 psychological level.
Failure there would likely invalidate the current recovery attempt and return control to sellers.
Final Outlook
From a technical perspective, MemeCore appears to be transitioning from weakness into cautious recovery. The false breakdown below $1.00, combined with the reclaim of the 20 EMA, provides the strongest bullish evidence seen in several weeks.
However, traders should remain patient. The chart has spent an extended period moving sideways, and genuine trend reversals require confirmation through higher highs, higher lows, and expanding volume.
For now, the bias has shifted from bearish to cautiously bullish, with the $1.20–$1.30 resistance zone representing the next major test. A successful breakout above this range could mark the beginning of a much larger recovery, while rejection would likely extend the current consolidation phase before the market makes its next decisive move.
Disclaimer: This analysis is for informational and educational purposes only and should not be considered financial or investment advice. Cryptocurrency markets are highly volatile, and traders should conduct their own research and implement appropriate risk management before making any trading decisions.