


Bitcoin (BTC) is back at the center of the crypto market after a powerful recovery from the $60,000–$70,000 zone. But with BTC now trading around $79,000–$80,000, the rally is entering a much more important technical area.
The latest Bitcoin price action shows something interesting across the daily, weekly, and monthly charts: the market has broken out of a long-term descending structure, but Bitcoin has now reached a major resistance zone that could determine whether this recovery develops into a much larger bullish trend or pauses for another correction.
At the same time, the technical breakout is being supported by renewed institutional demand. U.S. spot Bitcoin ETFs recorded roughly $1.6 billion of inflows from Monday through Thursday last week, while the seven-session total recently reached around $2.5 billion, according to Dow Jones Market Data cited by The Wall Street Journal.
So, is Bitcoin finally preparing for another major move higher?
The charts suggest that $80,000–$84,000 is the answer.
Bitcoin Breaks Out of Its Long-Term Downtrend
The most important development on the daily chart is the break above the descending trendline that had been controlling Bitcoin’s recovery for months.
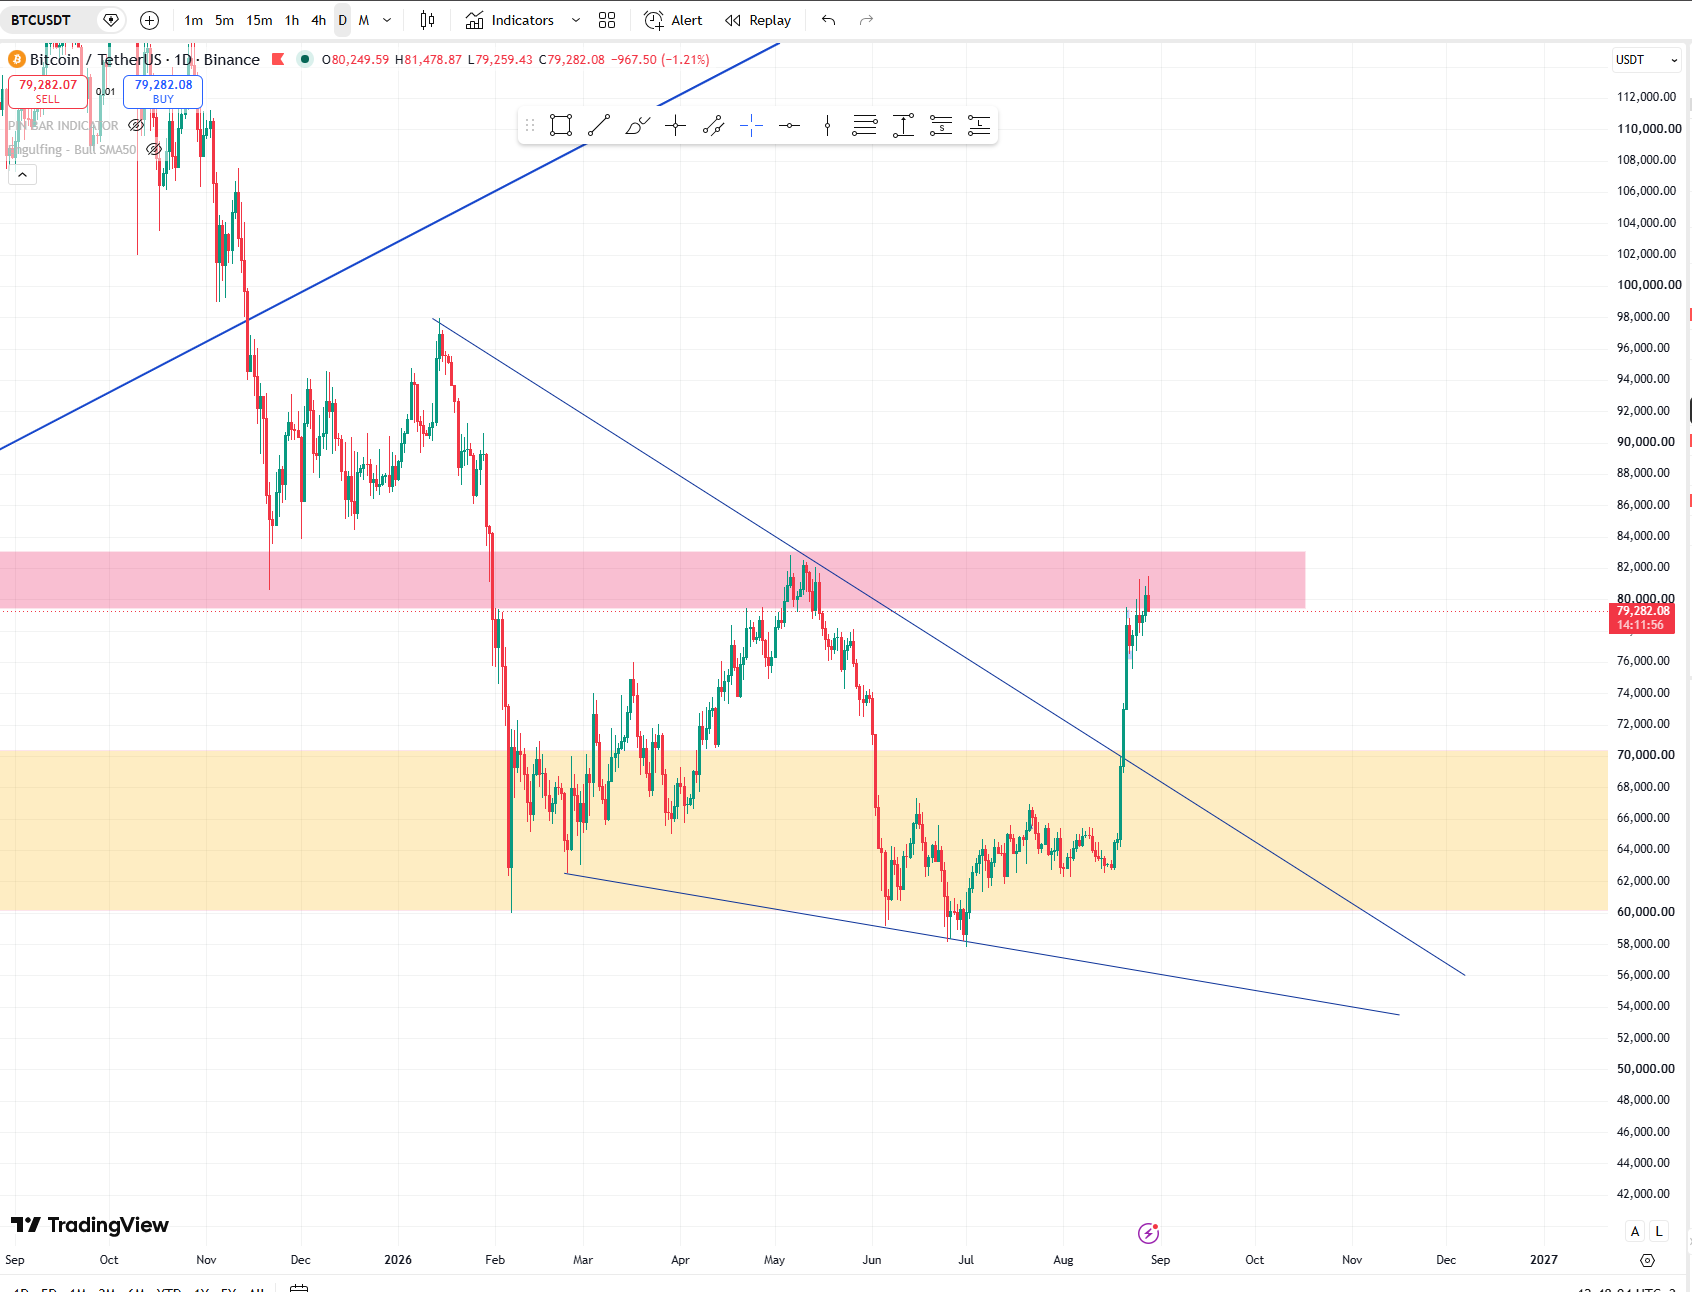
After falling sharply from the previous cycle high, BTC spent a significant period trading inside a broad declining structure. The lower part of that structure repeatedly pushed Bitcoin toward the $58,000–$62,000 area, while the upper trendline consistently rejected rallies.
That changed recently.
Bitcoin first established a base around the $60,000–$65,000 region, then began creating higher lows. The move eventually accelerated, pushing BTC through the descending trendline and back above $70,000.
The breakout was not a small move.
Bitcoin quickly moved toward $80,000, confirming that buyers were willing to chase price significantly higher.
From a technical perspective, this is an important improvement because the market has moved from:
lower highs + lower lows
toward: higher lows + breakout + recovery toward previous resistance.
However, a breakout is only meaningful if Bitcoin can hold above the structure after the initial move.
And that brings us to the most important level on the chart.
$80,000–$84,000 Is the Battle Zone
The daily, weekly and monthly charts all point toward the same area.
Bitcoin is currently approaching a broad resistance zone around $80,000–$84,000.
This is not simply an arbitrary horizontal level.
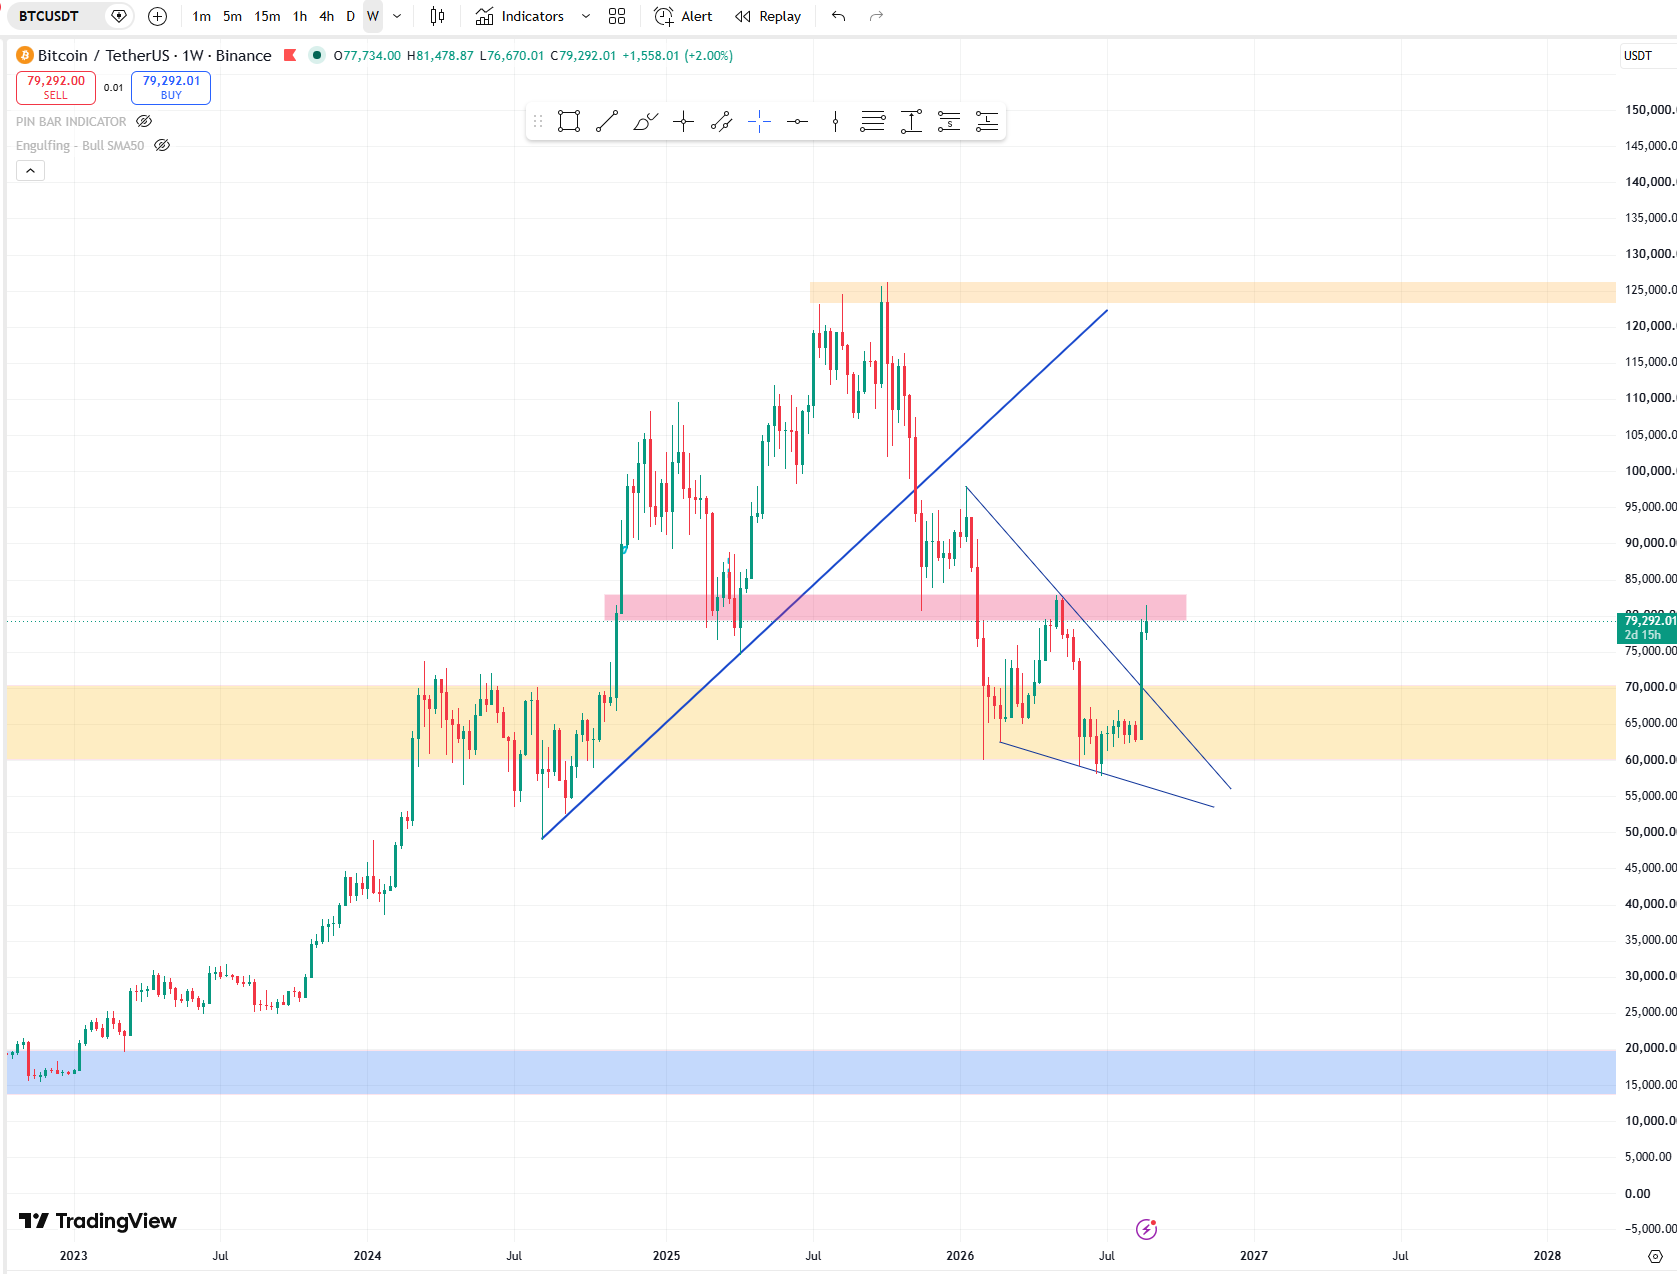
Historically, this area has acted as an important battlefield between buyers and sellers. On the weekly chart, the zone sits directly around the current price, while the monthly chart shows the same region as a major resistance area.
The daily chart makes the situation even more interesting.
BTC has already broken above the descending trendline and is now testing the horizontal resistance zone.
This creates two possible scenarios.
Bullish scenario: clean breakout
If Bitcoin can achieve a strong daily and preferably weekly close above $83,000–$84,000, the current structure would become significantly more bullish.
That would mean buyers have not only broken the descending trendline but have also overcome the major horizontal resistance sitting directly above it.
In that situation, the next major areas to watch would be:
- $88,000–$90,000
- $95,000–$100,000
- $110,000–$115,000
- $123,000–$125,000
The final zone is particularly important on the weekly and monthly charts because it corresponds with the major resistance area drawn near the previous cycle highs.
A move toward $100,000 would therefore be a realistic intermediate target if BTC confirms the breakout.
The Bearish Scenario: Another Rejection at $80K
There is also a reason not to become overly bullish too quickly.
Bitcoin has already experienced a substantial recovery.
Recent market data shows BTC briefly trading above $81,000, before falling back below $80,000. Profit-taking around the psychological $80,000 level has already appeared.
That makes the current area a potential distribution zone.
If BTC repeatedly fails to close above $80,000–$84,000, sellers could regain control.
The first important downside area would be around $70,000, followed by the broader $60,000–$65,000 support zone visible on the charts.
Interestingly, this lower yellow zone has already played an important role during the current structure.
Bitcoin spent months consolidating inside this area before the latest breakout.
That means a pullback toward $65,000–$70,000 would not necessarily destroy the bullish thesis. In fact, if Bitcoin were to retest this region and successfully establish a higher low, it could provide a much stronger foundation for another attempt at $80,000+.
The key difference would be how Bitcoin reacts at support.
ETF Demand Is Giving the Rally a Stronger Foundation
The technical setup is happening at a time when institutional demand for Bitcoin has improved considerably.
U.S. spot Bitcoin ETFs recorded $1.92 billion in net inflows during the week ending August 21, their strongest weekly performance since October 2025.
The buying continued afterward.
On August 24, U.S. spot Bitcoin ETFs reportedly attracted approximately $337.6 million, with BlackRock’s IBIT accounting for more than $200 million of the inflows.
On August 26, another $232.12 million entered spot Bitcoin ETFs.
And on August 27, Bitwise reported around $22 million of Bitcoin inflows among its U.S. crypto ETPs.
This matters because Bitcoin’s current recovery isn’t being driven exclusively by retail traders chasing a green candle.
Institutional capital is participating.
That doesn’t guarantee that Bitcoin will continue higher, but it gives the rally a much healthier underlying demand profile than a purely speculative move.
The Macro Story Is Also Helping Bitcoin
There is another factor behind Bitcoin’s recent strength: the broader macroeconomic environment.
Bitcoin’s rally has coincided with renewed concerns surrounding the U.S. dollar, government debt and potential currency debasement.
The U.S. Treasury’s decision to increase purchases of longer-dated Treasury securities has contributed to expectations that policymakers are willing to support liquidity and stabilize the bond market. Bitcoin and gold both benefited from this narrative.
This is particularly important because Bitcoin is increasingly being traded as a macro asset rather than simply as a cryptocurrency.
Investors who are concerned about:
- government debt,
- currency debasement,
- inflation,
- monetary policy,
- and declining confidence in fiat currencies
can increasingly access Bitcoin through regulated ETFs.
That creates a very different demand structure compared with previous Bitcoin cycles.
However, macro risks haven’t disappeared.
Markets are currently watching the Federal Reserve closely, particularly around the Jackson Hole event and future interest-rate expectations. Meanwhile, September brings additional risks involving inflation, central-bank policy and geopolitical uncertainty.
So Bitcoin’s bullish setup still has an important condition:
What the Weekly Bitcoin Chart Is Telling Us
The weekly chart provides perhaps the clearest picture.
Bitcoin has moved from the $60,000–$65,000 accumulation/support area toward the $80,000 resistance zone.
The move has also taken BTC back above the descending trend structure.
But the weekly candle is now approaching the exact area where sellers previously appeared.
This makes the next weekly close extremely important.
A weekly close above the resistance zone would significantly strengthen the argument that the larger correction is ending.
Conversely, a long upper wick followed by a bearish weekly close would warn that Bitcoin is still trapped below major resistance.
For long-term traders, the weekly close is more important than an intraday spike above $80,000.
Bitcoin can trade above $80,000 for several hours and still fail the breakout.
What matters is whether buyers can hold the level.
Bitcoin Price Targets to Watch
Based on the multi-timeframe structure shown in the charts, these are the major levels I would watch:
| BTC Level | Importance |
|---|---|
| $60K–$65K | Major long-term support |
| $70K | Important intermediate support |
| $76K–$78K | Short-term breakout/retest area |
| $80K–$84K | Major resistance / breakout zone |
| $88K–$90K | First upside target after breakout |
| $95K–$100K | Major psychological target |
| $110K–$115K | Higher-timeframe resistance |
| $123K–$125K | Major long-term resistance |
The most important level isn’t necessarily the highest target.
Bitcoin needs to prove that the old resistance has become new support.
Bitcoin Price Prediction: What Comes Next?
My reading of the current structure is cautiously bullish, but not blindly bullish.
The reason is simple.
The technical structure has improved significantly:
Long-term support → accumulation → higher lows → descending trendline breakout → $80K retest
At the same time, ETF inflows have returned strongly and macro conditions have provided another catalyst for Bitcoin and other hard assets.
But Bitcoin is now standing directly underneath one of its most important resistance zones.
If BTC breaks and holds $84K:
The probability of a move toward $90K and then $95K–$100K increases significantly.
A sustained move above $100K would open the door toward the $110K–$125K region, which is the major upside area highlighted on the higher-timeframe charts.
If BTC gets rejected:
A correction toward $70K would be the first level to watch.
If $70K fails, the larger $60K–$65K zone becomes critical.
Importantly, a pullback does not automatically mean the bullish structure is dead. As long as Bitcoin continues to establish higher lows and maintains the broader breakout structure, dips could simply represent retests rather than the beginning of another major bear trend.
Final Takeaway
Bitcoin has changed the conversation.
A few weeks ago, the market was focused on whether BTC could hold the $60,000–$65,000 region. Today, the discussion is about whether Bitcoin can reclaim $80,000 and potentially challenge $100,000 again.
The technical chart supports the idea of a recovery: Bitcoin has broken a major descending trendline and moved aggressively out of its long consolidation zone.
The fundamental backdrop is also improving. Spot Bitcoin ETF inflows have returned, institutional demand has strengthened, and concerns surrounding the dollar, government debt and liquidity are supporting demand for alternative assets.
But the market has reached a decision point.
$80K–$84K is the line in the sand.
A confirmed breakout above this region could transform the current recovery into a much larger Bitcoin rally, with $90K, $100K and eventually $120K+ becoming increasingly relevant.
A rejection, on the other hand, could send BTC back toward $70K or even $60K–$65K for another test of demand.
For now, the chart is bullish above the breakout structure, but confirmation above $84K is still needed.
Bitcoin doesn’t need to break $100,000 today.
First, it needs to prove that $80,000 is no longer resistance.
This analysis is based on the supplied BTC/USDT charts and recent market developments. It is for informational purposes only and should not be considered financial advice.