

XRP is showing early signs of a potential recovery after breaking above a descending trendline on the four-hour chart. In this technical analysis, Mog Hosseini examines XRP’s recent price action, highlighting a potential move toward the $1.02–$1.03 resistance zone, followed by a possible retest of support before another upward attempt toward $1.06.
However, the bullish scenario still needs confirmation as XRP approaches a major resistance zone.
XRP Breaks Above Descending Trendline
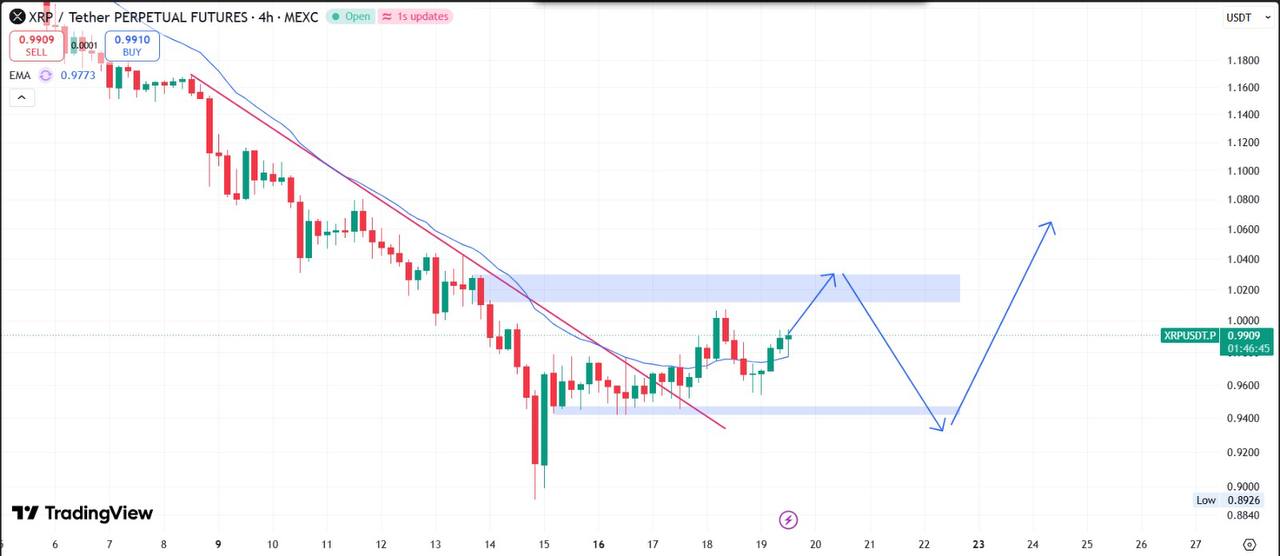
The four-hour XRP/USDT perpetual futures chart on MEXC shows that the token has recently moved above a descending trendline that had guided its price lower.
Before this development, XRP experienced a prolonged decline from levels above $1.60, eventually reaching a low near $0.89. The price then began consolidating around the $0.94–$0.97 area.
The latest recovery has pushed XRP toward approximately $0.99, with the price also moving above the EMA shown on the chart, near $0.977.
This development suggests that short-term selling pressure may be weakening. However, a trendline breakout alone does not confirm a full reversal. Traders will likely watch whether XRP can maintain its position above the broken trendline and continue forming higher lows.
$1.02–$1.03 Emerges as Key Resistance
The next important area for XRP is the resistance zone between $1.02 and $1.03.
This region represents a potential obstacle for the current recovery. If buyers manage to push XRP into this zone, the market could face renewed selling pressure.
A decisive four-hour close above the resistance area would strengthen the bullish setup and could open the door to a move toward the next projected level around $1.06.
However, failure to break through this zone could result in another period of consolidation or a pullback toward lower support.
Could XRP Retest $0.94 Before Moving Higher?
The projected price path also includes a possible correction after XRP tests the $1.02–$1.03 resistance area.
The chart identifies $0.94–$0.95 as an important support zone. Under this scenario, XRP could initially move higher toward resistance, pull back to retest this support area, and then attempt another upward move.
Such a retest could help determine whether buyers are willing to defend the recently established recovery structure.
If the support zone holds, the chart suggests a possible continuation toward $1.06. On the other hand, a clear breakdown below $0.94 would weaken the bullish outlook and invalidate an important part of the projected scenario.
XRP Price Levels to Watch
Based on the four-hour chart, traders may want to monitor the following levels:
| Price level | Technical significance |
|---|---|
| $1.06 | Potential upside target |
| $1.02–$1.03 | Major resistance zone |
| $0.99–$1.00 | Price area at the time of analysis |
| $0.94–$0.95 | Key support and potential retest zone |
| $0.89 | Recent chart low |
These levels represent the technical zones identified in the analysis, not guaranteed price targets.
What Could Happen Next for XRP?
XRP’s short-term outlook depends largely on how the price reacts around $1.02–$1.03.
A successful breakout above this resistance could strengthen the recovery scenario and make $1.06 the next level to watch. Alternatively, rejection could send XRP back toward $0.94–$0.95, where buyers would need to defend support.
For now, the break above the descending trendline offers an early bullish signal, but confirmation remains important. Traders should monitor four-hour candle closes, trading volume, and the market’s reaction at the highlighted support and resistance zones.
The coming sessions could determine whether XRP is beginning a broader recovery or simply experiencing a temporary bounce within its previous downtrend.
This article presents technical analysis based on the XRP/USDT four-hour chart. It is for informational purposes only and does not constitute investment advice. Cryptocurrency perpetual futures trading involves significant risk.