


As Bitcoin resurfaces above $56K, the bulls are back for the altcoins. Solana enters the list of top performers with a bullish trend and a sudden recovery. Sustaining dominance above the critical support, SOL price brings an opportunity to buy the dip. Will this potential bull cycle reclaim the $150 mark? Read this analysis to know more!
SOL Price Performance
In the weekly chart, the SOL price trend shows constant support from the 50% Fibonacci level at $129.87 and the 50 weekly EMA. Currently, the weekly chart reveals a consolidation phase between the 78.60% Fibonacci level at $198 with the bottom support of 50% Fibonacci level.
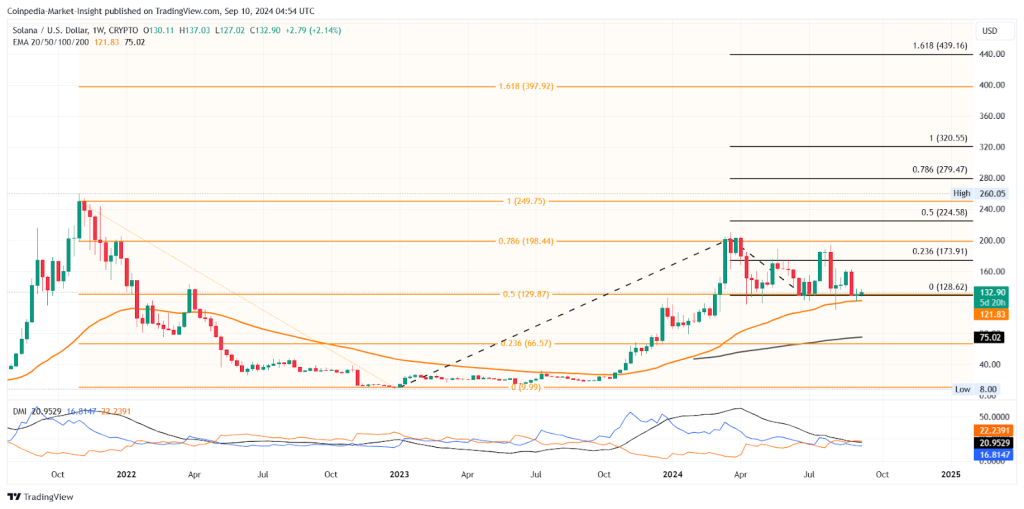
The lower high formation within the consolidation range reveals a weakness in the bullish momentum. However, the recent possibility of a morning star pattern near the crucial support teases a new bullish cycle.
The DMI indicator in the weekly chart reveals an indecisive trend between the VI lines. Further, a declining trend is visible in the ADX line during the SOL price consolidation phase.
Hence, the momentum is declining, but the trend still needs to be decided. A bullish cycle will reveal a positive alignment in the VI lines, and a potential uptick in the ADX line will help sustain the uptrend.
Using the trend-based Fibonacci level, the SOL price uptrend shows the next resistance at 23.60% at $173. The next resistance lies at the $200 ceiling and the $224 mark.
Solana Whales Back For More?
A Solana whale recently scooped 34,807 SOL tokens, amounting to $4.52 million. This is part of a larger accumulation strategy, with the whale having withdrawn nearly 206,951 SOL tokens worth $29.3 million.
These withdrawals came from Binance and MEXC, with an average buying price of $142. Following this aggressive buy, the whale continued the momentum by staking 115,135 SOL tokens, valued at $15.3 million, signaling a calculated long-term play.
Solana’s 4-Hour Consolidation
In the 4-hour chart, the SOL price action reveals a consolidation between the 38.20% and 23.60% Fibonacci levels at $136.65 and $125.81, respectively. The bullish recovery surpasses the 50 EMA and challenges the 38.20% level.
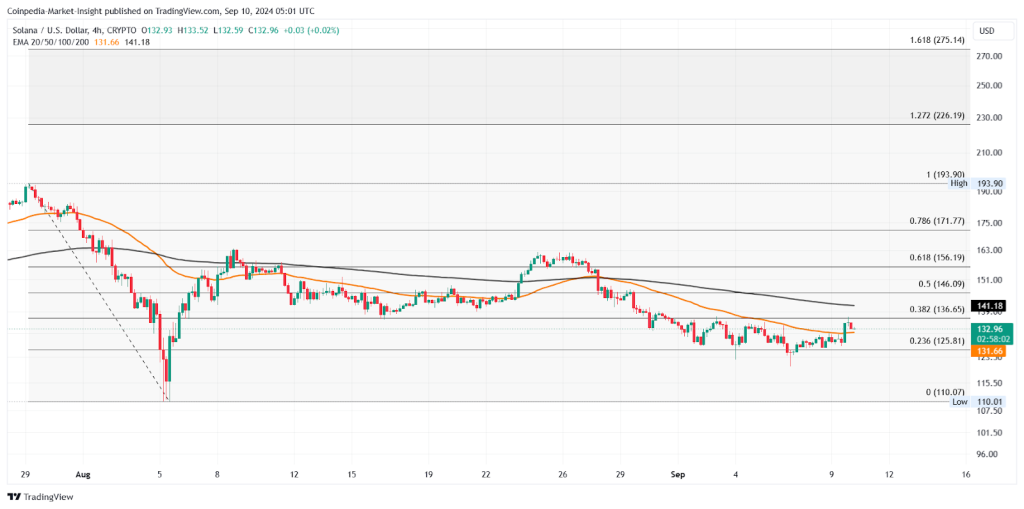
However, the evening star pattern delays the bullish breakout. Upon a bullish breakout, the Solana price trend will likely hit the $156 mark at $68.10. Conversely, the crucial support for the Solana price action is $125.81 and $110.07.
Final Thoughts
The recent Solana (SOL) analysis highlights the cryptocurrency’s potential for a bullish recovery after consolidating between key Fibonacci levels. Despite a current dip in momentum, indicators such as the possible formation of a morning star pattern and whale accumulation suggest optimism. A key factor will be Solana’s ability to break through resistance levels, particularly around $173 and $200, which could signal a sustained uptrend.
However, the weakening bullish momentum and consolidation phase reflect uncertainty, so while whales appear to be making long-term moves, traders should remain cautious until a clearer trend emerges.
Article Source: Coingape