


Bitcoin’s latest sell-off has pushed the cryptocurrency back toward one of its most closely watched long-term technical indicators: the 200-week simple moving average (SMA). After losing the $70,000 psychological level, BTC briefly traded below the 200-week trendline, raising concerns that the market could be entering a deeper correction.
The decline has also brought an important support zone between $66,000 and $67,000 into focus. Bitcoin’s daily chart shows a series of lower highs, a breakdown below previous support near $80,000, and a price trading well beneath its 20-day exponential moving average (EMA).
At the same time, billions of dollars in leveraged positions have been liquidated, while continued withdrawals from US spot Bitcoin ETFs have added to the pressure.
With Bitcoin approaching a critical long-term support area, traders are watching whether buyers can prevent another weekly close below the 200-week moving average.
Bitcoin Falls Below $69,000 as Selling Pressure Accelerates
Bitcoin experienced another sharp decline on November 13, falling below $69,000 for the first time since August 20. The cryptocurrency traded near $68,400 during early Friday trading, representing a decline of approximately 7% over 24 hours, according to The Block.
The move followed a breakdown below $72,000 and the psychological $70,000 level. Once these areas failed to hold, selling pressure accelerated as leveraged bullish positions were forced out of the market.
Ethereum also weakened, falling toward $1,900, while other major cryptocurrencies recorded additional losses.
The latest decline represents a significant change in short-term market structure. Bitcoin had previously recovered toward $87,000, but repeated failures to maintain higher price levels have allowed sellers to regain control.
Bitcoin Returns to Its 200-Week Moving Average
One of the most important developments in the latest correction is Bitcoin’s return to its 200-week simple moving average.
On November 13, Bitcoin briefly fell toward $67,500, moving below the 200-week SMA, which was positioned near $67,993. This marked the first interaction with the long-term indicator since August.
The 200-week moving average is widely followed because it represents Bitcoin’s average closing price over approximately 3.8 years. During previous market cycles, it has served as an important reference point for identifying long-term support and potential bear-market conditions.
However, the indicator is not guaranteed to act as a price floor. Bitcoin has previously traded below it for extended periods, including during the 2022 bear market.
The distinction between an intraday breakdown and a confirmed weekly close is particularly important. A temporary move below the indicator does not necessarily establish a long-term bearish trend. Traders will be watching whether Bitcoin can reclaim the average before the weekly candle closes.
Bitcoin Daily Chart Shows Critical Support Near $66,000
The latest Binance BTC/USDT daily chart highlights the technical deterioration that has developed since October.
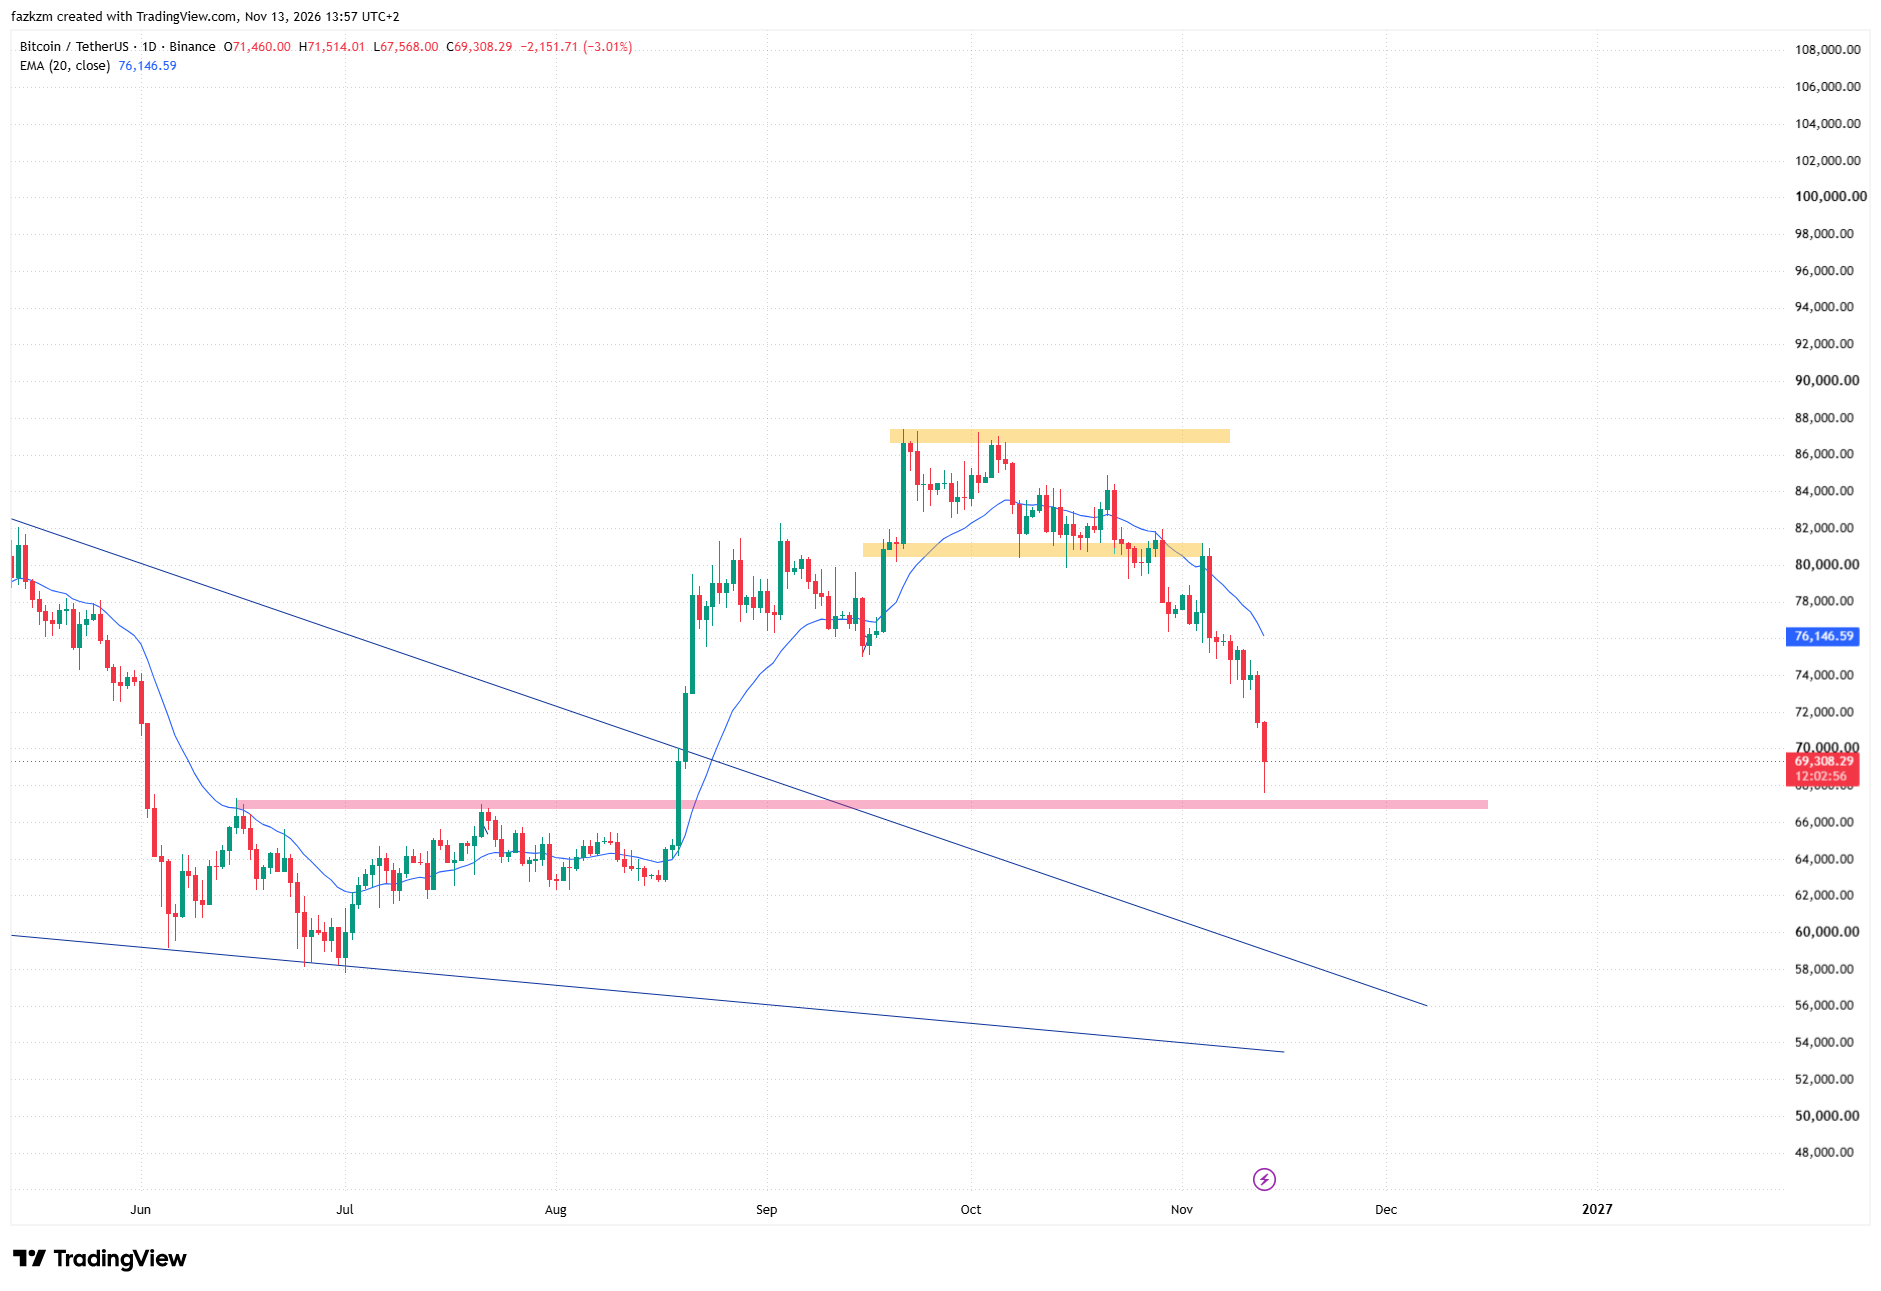
Bitcoin previously traded inside a recovery structure, with resistance emerging around $80,000–$81,000 and a stronger supply zone near $87,000. However, sellers eventually pushed the price below the lower resistance area, followed by a series of declining daily candles.
The chart also shows Bitcoin trading below its 20-day EMA, which is positioned around $76,145 in the supplied screenshot. This moving average has turned into an important dynamic resistance level during the current correction.
The most important technical zones are now concentrated around the following levels:
| Price zone | Technical significance |
|---|---|
| $87,000–$88,000 | Major overhead resistance |
| $80,000–$81,000 | Former support turned resistance |
| $76,000–$77,000 | 20-day EMA resistance area |
| $69,000–$70,000 | Psychological price zone |
| $66,000–$67,000 | Critical horizontal support |
| $62,000–$63,000 | Potential next downside area |
| $57,700–$58,000 | Deeper bearish scenario |
The pink horizontal zone on the supplied chart marks the $66,000–$67,000 support region. This area is particularly important because it overlaps with the price region surrounding the 200-week moving average.
Bitcoin’s recent daily candle also shows a lower wick reaching approximately $65,553 in the chart’s displayed OHLC data. This suggests that buyers attempted to respond after the price moved into the lower support area.
Nevertheless, a recovery from this zone needs confirmation. A sustained move back above $70,000 would be an initial sign that buyers are returning, while a stronger recovery above the 20-day EMA would provide more convincing evidence of improving momentum.
Liquidations Reach $1.47 Billion as Long Positions Collapse
The latest Bitcoin decline triggered another major liquidation event across cryptocurrency derivatives markets.
According to data cited by The Block from CoinGlass, approximately $1.47 billion in leveraged crypto positions were liquidated over 24 hours on November 13. Long positions accounted for approximately $1.31 billion of that total.
More than 175,000 traders were affected, while approximately $798 million in positions were liquidated during a four-hour period alone.
The concentration of liquidations on the bullish side highlights how heavily leveraged traders were positioned for a recovery.
When Bitcoin broke below $72,000 and subsequently lost $70,000, automatic liquidation orders accelerated selling pressure. These forced market orders can create a feedback loop in which falling prices trigger additional liquidations, pushing the market lower.
The liquidation figures also demonstrate why leveraged trading can become particularly dangerous during periods of thin liquidity and rapidly changing sentiment.
Bitcoin ETF Outflows Add to Institutional Selling Pressure
Institutional demand has also weakened during the latest market correction.
US spot Bitcoin ETFs recorded approximately $1.44 billion in net outflows over five consecutive trading sessions, according to data cited by Cointelegraph on November 12.
BlackRock’s iShares Bitcoin Trust (IBIT) experienced more than $2 billion in net outflows over nine consecutive trading sessions through Wednesday. The fund recorded approximately $269.7 million in withdrawals during Wednesday’s session alone.
These developments suggest that institutional investors have become more cautious about Bitcoin exposure.
ETF outflows do not automatically mean every withdrawal results in an immediate equivalent Bitcoin sale. However, sustained redemptions can create additional selling pressure as fund holdings adjust to investor demand.
The latest ETF figures also came alongside weaker spot demand and a persistently negative Coinbase premium, factors that derivatives analysts identified as signs of limited buying interest.
Macroeconomic Uncertainty and Nvidia Shock Weigh on Risk Assets
Bitcoin’s decline has taken place against a challenging macroeconomic backdrop.
The latest market reports point to stronger-than-expected US inflation data, which has increased expectations that the Federal Reserve could raise interest rates in December.
Higher interest-rate expectations generally create a more difficult environment for speculative assets because investors may become less willing to hold volatile investments when safer yields become more attractive.
Another unexpected development came from the technology sector. Nvidia’s leadership crisis and the resignation of cofounder Jensen Huang as CEO added uncertainty to an already fragile risk environment.
Bitcoin and technology stocks have shown periods of strong correlation, particularly when investors are reassessing liquidity and exposure to growth-oriented assets.
The combination of inflation concerns, Federal Reserve uncertainty, technology-sector volatility, and leveraged crypto liquidations has therefore contributed to the latest decline.
What Happens Next? Two Bitcoin Price Scenarios
Bitcoin is approaching a critical technical decision point. Whether the $66,000–$67,000 region holds could determine the next major move.
Bullish Scenario: Bitcoin Reclaims $70,000
If buyers successfully defend the current support region, Bitcoin could attempt a recovery toward $70,000.
A sustained move above this psychological level would be an initial sign of stabilization. The next important resistance would be around $76,000–$77,000, where the 20-day EMA is positioned on the supplied chart.
A stronger recovery above $80,000–$81,000 would be necessary to challenge the bearish structure that developed during November.
However, ETF outflows, weak spot demand, and elevated market volatility remain obstacles to a sustained recovery.
Bearish Scenario: Bitcoin Loses $66,000 Support
If Bitcoin fails to defend the $66,000–$67,000 region, the market could experience another downward move.
A confirmed daily breakdown below this zone would weaken the current support structure and increase the possibility of a test toward $62,000–$63,000.
A more severe correction could bring the $57,700–$58,000 region into focus. This level was highlighted by Material Indicators cofounder Keith Alan as a potential downside target if Bitcoin’s weekly RSI loses the 41.5 support level.
Such a move is not confirmed, but it illustrates the downside risk if both price support and longer-term momentum indicators deteriorate.
Frequently Asked Questions
Has Bitcoin broken below the 200-week moving average?
Bitcoin briefly traded below its 200-week SMA on November 13, when its price fell toward $67,500 and the indicator was near $67,993. A confirmed weekly close below the average would provide stronger evidence of a long-term technical breakdown.
What is the most important Bitcoin support level right now?
The $66,000–$67,000 region is an important support zone on the supplied daily chart. It also overlaps with the area around Bitcoin’s 200-week moving average, making it a key level for traders to monitor.
Why are Bitcoin liquidations increasing?
Bitcoin’s rapid decline triggered forced closures of leveraged positions. When prices fall below liquidation thresholds, exchanges automatically close positions, adding market selling pressure and potentially accelerating the decline.
Are Bitcoin ETF outflows contributing to the crash?
Yes. US spot Bitcoin ETFs recorded approximately $1.44 billion in net outflows over five consecutive sessions, while BlackRock’s IBIT experienced more than $2 billion in withdrawals over nine consecutive sessions through November 12. These outflows indicate weaker institutional demand and can contribute to selling pressure.
Could Bitcoin fall toward $57,700?
A move toward $57,700 is one potential bearish scenario identified by Material Indicators cofounder Keith Alan. He linked this risk to a possible breakdown in Bitcoin’s weekly RSI below 41.5. It remains a conditional scenario rather than a confirmed price target.
Bitcoin’s Long-Term Support Faces Its Biggest Test in Months
Bitcoin’s latest decline has brought the market back to a level that has historically attracted significant attention from long-term investors.
The 200-week moving average, currently near $68,000, is being tested as ETF withdrawals, leveraged liquidations, and macroeconomic uncertainty weigh on sentiment.
The daily chart also highlights the importance of the $66,000–$67,000 support zone. A successful defense could provide the foundation for a recovery, while a sustained breakdown could expose Bitcoin to another significant correction.
For now, the market remains under pressure. Traders will be watching the weekly close, ETF flow data, and Bitcoin’s ability to reclaim lost support levels before determining whether the latest decline represents a temporary liquidation-driven correction or the beginning of a deeper bearish phase.
This article is for informational purposes only and does not constitute investment advice. Cryptocurrency markets are highly volatile, and all technical levels are subject to change.